1991 New Jersey State Senate election
The 1991 New Jersey State Senate elections were held on November 5.
| |||||||||||||||||||||||||
All 40 seats in the New Jersey State Senate 21 seats needed for a majority | |||||||||||||||||||||||||
|---|---|---|---|---|---|---|---|---|---|---|---|---|---|---|---|---|---|---|---|---|---|---|---|---|---|
| |||||||||||||||||||||||||
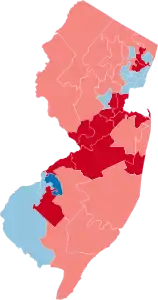 Results by district Democratic hold Democratic gain Republican hold Republican gain | |||||||||||||||||||||||||
| |||||||||||||||||||||||||
.jpg.webp)
The election took place mid-way through the term of Governor James Florio. The results were a landslide victory for the Republican Party amidst a tax revolt by New Jersey voters. Democrats picked up only one seat, that of Senator Lee B. Laskin. Republicans picked up eleven Democrat seats, winning control of the Senate for the first time since 1978.
| Contents Incumbents not running • Summary of results By District: 1 • 2 • 3 • 4 • 5 • 6 • 7 • 8 • 9 • 10 • 11 • 12 • 13 • 14 • 15 • 16 • 17 • 18 • 19 • 20 • 21 • 22 • 23 • 24 • 25 • 26 • 27 • 28 • 29 • 30 • 31 • 32 • 33 • 34 • 35 • 36 • 37 • 38 • 39 • 40 |
Background
Redistricting
.svg.png.webp)
.svg.png.webp)
As required, the New Jersey legislature redistricted its state legislative districts in advance of the 1991 election. Redistricting was on balance considered to have favored Republicans, reflecting a growth in the suburbs relative to the state's urban cores during the 1980s.[1]
Tax increase
A centerpiece of the Florio administration's legislative agenda was the passage of a $2.8 billion tax increase. Republicans centered their 1991 campaign on opposition to the increase, as did even some incumbent Democrats, such as Senator Paul Contillo.[1]
According to the Florio administration, the tax increase was designed to aid blue-collar workers, who were "also the people most upset by enactment of the taxes."[1]
Gun control
Another major legislative achievement of the Florio administration was a strict gun control measure. The bill's passage led the National Rifle Association to spend nearly $250,000 in the 1991 elections targeting candidates in both parties who had voted in favor of the bill and supporting those who pledged to repeal it.[2]
Incumbents not running for re-election
Democratic
- Daniel Dalton (District 4)
- John F. Russo (District 10)
- Carmen A. Orechio (District 30)
Summary of results
- Cafiero won a 1990 special election to complete the unexpired term of Senator James R. Hurley, who resigned to join the New Jersey Casino Control Commission.
- Foy was appointed to complete the unexpired term of Senator Catherine A. Costa, who resigned to become Director of the New Jersey Division of Alcoholic Beverage Control.
- Haines won a 1984 special election to complete the term of Jim Saxton, who resigned to take a seat in the U.S. House of Representatives.
- Palaia won a 1989 special election to complete the unexpired term of Senator Frank Pallone, who resigned to take his seat in the U.S. House of Representatives.
- Bennett won a 1989 special election to complete the unexpired term of Senator S. Thomas Gagliano, who resigned to become the director of NJ Transit.
- Phillips was appointed to complete the unexpired term of Senator Richard Van Wagner, who resigned to join the New Jersey Sports and Exposition Authority.
- Schluter was appointed to complete the unexpired term of Dick Zimmer, who resigned to take his seat in the U.S. House of Representatives in January 1991.
- Littell won a 1990 special election to complete the unexpired term of Senator Wayne Dumont, who retired in July 1990.
- Rice won a special November 1986 election to complete the unexpired term of John P. Caufield, who died in August 1986.
- Redistricted to 36th district, declined to challenge Senator Ambrosio.
- Menendez won a March 1991 special election to complete the unexpired term of Senator Christopher Jackman, who died.
- Girgenti won a 1990 special election to complete the unexpired term of Senator Frank X. Graves Jr., who died.
- McNamara won a November 1985 special election to complete the unexpired term of Senator Garrett Hagedorn, who died in August 1985.
Close races
Seats where the margin of victory was under 10%:
- District 15, 1.8% gain
- District 4, 3.4% gain
- District 17, 4.0%
- District 36, 4.0% gain
- District 35, 6.4%
- District 2, 6.6%
- District 18, 7.0% gain
- District 7, 7.2% gain
- District 37, 7.2%
District 1
Democratic primary
| Party | Candidate | Votes | % | |
|---|---|---|---|---|
| Democratic | Ronald J. Casella | 3,037 | 100% | |
| Total votes | 3,037 | 100% | ||
Republican primary
| Party | Candidate | Votes | % | |
|---|---|---|---|---|
| Republican | James Cafiero (incumbent) | 6,690 | 100% | |
| Total votes | 6,690 | 100% | ||
General election
| Party | Candidate | Votes | % | |
|---|---|---|---|---|
| Republican | James Cafiero (incumbent) | 31,624 | 62.0% | |
| Democratic | Ronald J. Casella | 19,404 | 38.0% | |
| Total votes | 51,028 | 100% | ||
District 2
Democratic primary
| Party | Candidate | Votes | % | |
|---|---|---|---|---|
| Democratic | Meg Worthington | 2,460 | 100% | |
| Total votes | 2,460 | 100% | ||
Republican primary
| Party | Candidate | Votes | % | |
|---|---|---|---|---|
| Republican | William Gormley (incumbent) | 5,369 | 54.17% | |
| Republican | Domenic Cappella | 4,542 | 45.83% | |
| Total votes | 9,911 | 100% | ||
General election
| Party | Candidate | Votes | % | |
|---|---|---|---|---|
| Republican | William Gormley (incumbent) | 22,731 | 53.3% | |
| Democratic | Meg Worthington | 19,908 | 46.7% | |
| Total votes | 42,639 | 100% | ||
District 3
Democratic primary
| Party | Candidate | Votes | % | |
|---|---|---|---|---|
| Democratic | Raymond Zane | 5,604 | 100% | |
| Total votes | 5,604 | 100% | ||
Republican primary
| Party | Candidate | Votes | % | |
|---|---|---|---|---|
| Republican | G. Erwin Sheppard (write-in) | 540 | 100% | |
| Total votes | 540 | 100% | ||
General election
| Party | Candidate | Votes | % | |
|---|---|---|---|---|
| Democratic | Raymond Zane (incumbent) | 31,648 | 60.9% | |
| Republican | G. Erwin Sheppard | 16,600 | 32.0% | |
| No Party Deals | Frank L. Sorrentino | 3,683 | 7.1% | |
| Total votes | 51,931 | 100% | ||
District 4
Democratic primary
| Party | Candidate | Votes | % | |
|---|---|---|---|---|
| Democratic | Anthony S. Marsella | 6,294 | 100% | |
| Total votes | 6,294 | 100% | ||
Republican primary
| Party | Candidate | Votes | % | |
|---|---|---|---|---|
| Republican | John J. Matheussen | 3,153 | 100% | |
| Total votes | 3,153 | 100% | ||
General election
| Party | Candidate | Votes | % | |
|---|---|---|---|---|
| Republican | John J. Matheussen | 21,553 | 51.7% | |
| Democratic | Anthony S. Marsella | 20,118 | 48.3% | |
| Total votes | 41,671 | 100% | ||
District 5
Democratic primary
| Party | Candidate | Votes | % | |
|---|---|---|---|---|
| Democratic | Walter Rand (incumbent) | 7,361 | 100% | |
| Total votes | 7,361 | 100% | ||
Republican primary
| Party | Candidate | Votes | % | |
|---|---|---|---|---|
| Republican | Rev. Edwin A. Martinez | 1,811 | 100% | |
| Total votes | 1,811 | 100% | ||
General election
| Party | Candidate | Votes | % | |
|---|---|---|---|---|
| Democratic | Walter Rand (incumbent) | 25,834 | 67.1% | |
| Republican | Rev. Edwin A. Martinez | 12,666 | 32.9% | |
| Total votes | 38,500 | 100% | ||
District 6
Democratic primary
| Party | Candidate | Votes | % | |
|---|---|---|---|---|
| Democratic | John Adler | 3,621 | 100% | |
| Total votes | 3,621 | 100% | ||
Republican primary
| Party | Candidate | Votes | % | |
|---|---|---|---|---|
| Republican | Lee B. Laskin (incumbent) | 4,407 | 100% | |
| Total votes | 4,407 | 100% | ||
General election
| Party | Candidate | Votes | % | |
|---|---|---|---|---|
| Democratic | John Adler | 31,289 | 55.4% | |
| Republican | Lee B. Laskin (incumbent) | 25,191 | 44.6% | |
| Total votes | 56,480 | 100% | ||
District 7
Democratic primary
| Party | Candidate | Votes | % | |
|---|---|---|---|---|
| Democratic | Thomas P. Foy (incumbent) | 6,238 | 100% | |
| Total votes | 6,238 | 100% | ||
Republican primary
| Party | Candidate | Votes | % | |
|---|---|---|---|---|
| Republican | Bradford S. Smith | 3,219 | 100% | |
| Total votes | 3,219 | 100% | ||
General election
| Party | Candidate | Votes | % | |
|---|---|---|---|---|
| Republican | Bradford S. Smith | 26,892 | 53.6% | |
| Democratic | Thomas P. Foy (incumbent) | 23,290 | 46.4% | |
| Total votes | 50,182 | 100% | ||
District 8
Democratic primary
| Party | Candidate | Votes | % | |
|---|---|---|---|---|
| Democratic | Thomas P. Long | 2,290 | 100% | |
| Total votes | 2,290 | 100% | ||
Republican primary
| Party | Candidate | Votes | % | |
|---|---|---|---|---|
| Republican | C. William Haines (incumbent) | 5,528 | 100% | |
| Total votes | 5,528 | 100% | ||
General election
| Party | Candidate | Votes | % | |
|---|---|---|---|---|
| Republican | C. William Haines (incumbent) | 28,850 | 66.3% | |
| Democratic | Harvey Dinerman | 14,644 | 33.7% | |
| Total votes | 43,494 | 100% | ||
District 9
Democratic primary
| Party | Candidate | Votes | % | |
|---|---|---|---|---|
| Democratic | Joseph Meglino | 4,172 | 100% | |
| Total votes | 4,172 | 100% | ||
Republican primary
| Party | Candidate | Votes | % | |
|---|---|---|---|---|
| Republican | Leonard T. Connors (incumbent) | 9,327 | 100% | |
| Total votes | 9,327 | 100% | ||
General election
| Party | Candidate | Votes | % | |
|---|---|---|---|---|
| Republican | Leonard T. Connors (incumbent) | 42,914 | 69.9% | |
| Democratic | Joseph Meglino | 18,448 | 30.1% | |
| Total votes | 61,362 | 100% | ||
District 10
Democratic primary
| Party | Candidate | Votes | % | |
|---|---|---|---|---|
| Democratic | John Paul Doyle | 3,310 | 100% | |
| Total votes | 3,310 | 100% | ||
Republican primary
| Party | Candidate | Votes | % | |
|---|---|---|---|---|
| Republican | Andrew R. Ciesla | 4,570 | 58.60% | |
| Republican | Tom Blomquist | 3,229 | 41.40% | |
| Total votes | 7,799 | 100% | ||
General election
| Party | Candidate | Votes | % | |
|---|---|---|---|---|
| Republican | Andrew R. Ciesla | 34,711 | 61.6% | |
| Democratic | John Paul Doyle | 21,643 | 38.4% | |
| Total votes | 56,354 | 100% | ||
District 11
Democratic primary
| Party | Candidate | Votes | % | |
|---|---|---|---|---|
| Democratic | Gloria R. Filippione | 2,239 | 88.96% | |
| Democratic | Irwin Zucker | 278 | 11.04% | |
| Total votes | 2,517 | 100% | ||
Republican primary
| Party | Candidate | Votes | % | |
|---|---|---|---|---|
| Republican | Joseph A. Palaia | 3,019 | 100% | |
| Total votes | 3,019 | 100% | ||
General election
| Party | Candidate | Votes | % | |
|---|---|---|---|---|
| Republican | Joseph A. Palaia | 35,349 | 65.2% | |
| Democratic | Gloria R. Filippone | 16,286 | 30.1% | |
| Non Lawyer | Thomas W. Appleby, Jr. | 1,738 | 3.2% | |
| Nonpartisan | Joshua Leinsdorf | 819 | 1.5% | |
| Total votes | 54,192 | 100% | ||
District 12
Democratic primary
| Party | Candidate | Votes | % | |
|---|---|---|---|---|
| Democratic | Joseph D. Youssouf | 3,165 | 100% | |
| Total votes | 3,165 | 100% | ||
Republican primary
| Party | Candidate | Votes | % | |
|---|---|---|---|---|
| Republican | John O. Bennett (incumbent) | 4,340 | 100% | |
| Total votes | 4,340 | 100% | ||
General election
| Party | Candidate | Votes | % | |
|---|---|---|---|---|
| Republican | John O. Bennett (incumbent) | 36,629 | 67.2% | |
| Democratic | Joseph D. Youssouf | 15,151 | 27.8% | |
| Abortion Is Murder | Pat Daly | 1,760 | 3.2% | |
| Libertarian | Helen L. Radder | 941 | 1.7% | |
| Total votes | 54,481 | 100% | ||
District 13
Democratic primary
| Party | Candidate | Votes | % | |
|---|---|---|---|---|
| Democratic | James T. Phillips (incumbent) | 3,525 | 100% | |
| Total votes | 3,525 | 100% | ||
Republican primary
| Party | Candidate | Votes | % | |
|---|---|---|---|---|
| Republican | Joe Kyrillos | 3,167 | 100% | |
| Total votes | 3,167 | 100% | ||
General election
| Party | Candidate | Votes | % | |
|---|---|---|---|---|
| Republican | Joe Kyrillos | 34,547 | 67.8% | |
| Democratic | James T. Phillips (incumbent) | 16,437 | 32.2% | |
| Total votes | 50,984 | 100% | ||
District 14
Democratic primary
| Party | Candidate | Votes | % | |
|---|---|---|---|---|
| Democratic | Francis J. McManimon (incumbent) | 3,654 | 100% | |
| Total votes | 3,654 | 100% | ||
Republican primary
| Party | Candidate | Votes | % | |
|---|---|---|---|---|
| Republican | Peter Inverso | 2,620 | 100% | |
| Total votes | 2,620 | 100% | ||
General election
| Party | Candidate | Votes | % | |
|---|---|---|---|---|
| Republican | Peter Inverso | 30,367 | 54.6% | |
| Democratic | Francis J. McManimon (incumbent) | 20,496 | 36.8% | |
| Independent | Peter P. Garibaldi | 4,791 | 8.6% | |
| Total votes | 55,654 | 100% | ||
District 15
Democratic primary
| Party | Candidate | Votes | % | |
|---|---|---|---|---|
| Democratic | Gerald R. Stockman (incumbent) | 7,691 | 82.56% | |
| Democratic | Richard N. Krajewski | 1,625 | 17.44% | |
| Total votes | 9,316 | 100% | ||
Republican primary
| Party | Candidate | Votes | % | |
|---|---|---|---|---|
| Republican | Dick LaRossa | 2,300 | 100% | |
| Total votes | 2,300 | 100% | ||
General election
| Party | Candidate | Votes | % | |
|---|---|---|---|---|
| Republican | Dick LaRossa | 22,465 | 50.9% | |
| Democratic | Gerald R. Stockman (incumbent) | 21,672 | 49.1% | |
| Total votes | 44,137 | 100% | ||
District 16
Democratic primary
| Party | Candidate | Votes | % | |
|---|---|---|---|---|
| Democratic | Bonnie C. Sovinee | 2,302 | 100% | |
| Total votes | 2,302 | 100% | ||
Republican primary
| Party | Candidate | Votes | % | |
|---|---|---|---|---|
| Republican | John H. Ewing | 8,757 | 100% | |
| Total votes | 8,757 | 100% | ||
General election
| Party | Candidate | Votes | % | |
|---|---|---|---|---|
| Republican | John H. Ewing | 33,059 | 68.4% | |
| Democratic | Bonnie C. Sovinee | 15,255 | 31.6% | |
| Total votes | 48,314 | 100% | ||
District 17
Democratic primary
| Party | Candidate | Votes | % | |
|---|---|---|---|---|
| Democratic | John A. Lynch Jr. (incumbent) | 3,059 | 100% | |
| Total votes | 3,059 | 100% | ||
Republican primary
| Party | Candidate | Votes | % | |
|---|---|---|---|---|
| Republican | Edward R. Tiller | 1,264 | 100% | |
| Total votes | 1,264 | 100% | ||
General election
| Party | Candidate | Votes | % | |
|---|---|---|---|---|
| Democratic | John A. Lynch Jr. (incumbent) | 17,053 | 52.0% | |
| Republican | Edward R. Tiller | 15,718 | 48.0% | |
| Total votes | 32,771 | 100% | ||
District 18
Democratic primary
| Party | Candidate | Votes | % | |
|---|---|---|---|---|
| Democratic | Harry S. Pozycki | 6,963 | 53.21% | |
| Democratic | Thomas H. Paterniti (incumbent) | 6,122 | 46.79% | |
| Total votes | 13,085 | 100% | ||
Republican primary
| Party | Candidate | Votes | % | |
|---|---|---|---|---|
| Republican | Jack Sinagra | 2,064 | 100% | |
| Total votes | 2,064 | 100% | ||
General election
| Party | Candidate | Votes | % | |
|---|---|---|---|---|
| Republican | Jack Sinagra | 28,638 | 53.5% | |
| Democratic | Harry S. Pozycki | 24,889 | 46.5% | |
| Total votes | 53,527 | 100% | ||
District 19
Democratic primary
| Party | Candidate | Votes | % | |
|---|---|---|---|---|
| Democratic | Laurence S. Weiss (incumbent) | 7,459 | 100% | |
| Total votes | 7,459 | 100% | ||
Republican primary
| Party | Candidate | Votes | % | |
|---|---|---|---|---|
| Republican | Randy Corman | 1,898 | 100% | |
| Total votes | 1,898 | 100% | ||
General election
| Party | Candidate | Votes | % | |
|---|---|---|---|---|
| Republican | Randy Corman | 25,536 | 55.6% | |
| Democratic | Laurence S. Weiss (incumbent) | 20,396 | 44.4% | |
| Total votes | 45,932 | 100% | ||
District 20
Democratic primary
| Party | Candidate | Votes | % | |
|---|---|---|---|---|
| Democratic | Raymond Lesniak (incumbent) | 7,402 | 100% | |
| Total votes | 7,402 | 100% | ||
Republican primary
| Party | Candidate | Votes | % | |
|---|---|---|---|---|
| Republican | Jeffrey B. Cohen | 1,171 | 100% | |
| Total votes | 1,171 | 100% | ||
General election
| Party | Candidate | Votes | % | |
|---|---|---|---|---|
| Democratic | Raymond Lesniak (incumbent) | 16,733 | 57.1% | |
| Republican | Jeffrey B. Cohen | 12,585 | 42.9% | |
| Total votes | 29,318 | 100% | ||
District 21
Democratic primary
| Party | Candidate | Votes | % | |
|---|---|---|---|---|
| Democratic | Kathy Mills | 3,242 | 100% | |
| Total votes | 3,242 | 100% | ||
Republican primary
| Party | Candidate | Votes | % | |
|---|---|---|---|---|
| Republican | C. Louis Bassano (incumbent) | 5,423 | % | |
| Total votes | 5,423 | 100% | ||
General election
| Party | Candidate | Votes | % | |
|---|---|---|---|---|
| Republican | C. Louis Bassano (incumbent) | 38,591 | 71.6% | |
| Democratic | Elly Manov | 15,311 | 28.4% | |
| Total votes | 53,902 | 100% | ||
District 22
Democratic primary
| Party | Candidate | Votes | % | |
|---|---|---|---|---|
| Democratic | June Fischer | 2,413 | 100% | |
| Total votes | 2,413 | 100% | ||
Republican primary
| Party | Candidate | Votes | % | |
|---|---|---|---|---|
| Republican | Donald DiFrancesco (incumbent) | 7,057 | 100% | |
| Total votes | 7,057 | 100% | ||
General election
| Party | Candidate | Votes | % | |
|---|---|---|---|---|
| Republican | Donald DiFrancesco (incumbent) | 32,872 | 78.2% | |
| Populist | John L. Kucek | 9,153 | 21.8% | |
| Total votes | 42,025 | 100% | ||
District 23
Democratic primary
| Party | Candidate | Votes | % | |
|---|---|---|---|---|
| Democratic | George Goceljak | 2,380 | 69.92% | |
| Democratic | Dan Seyler | 1,024 | 30.08% | |
| Total votes | 3,404 | 100% | ||
Republican primary
| Party | Candidate | Votes | % | |
|---|---|---|---|---|
| Republican | Bill Schluter | 8,242 | 100% | |
| Total votes | 8,242 | 100% | ||
General election
| Party | Candidate | Votes | % | |
|---|---|---|---|---|
| Republican | Bill Schluter | 34,936 | 72.4% | |
| Democratic | George Goceljak | 13,317 | 27.6% | |
| Total votes | 48,253 | 100% | ||
District 24
Democratic primary
| Party | Candidate | Votes | % | |
|---|---|---|---|---|
| Democratic | Frederick J. Katz Jr. | 1,937 | 100% | |
| Total votes | 1,937 | 100% | ||
Republican primary
| Party | Candidate | Votes | % | |
|---|---|---|---|---|
| Republican | Robert Littell (incumbent) | 8,119 | 52.78% | |
| Republican | George T. Daggett | 7,264 | 47.22% | |
| Total votes | 15,383 | 100% | ||
General election
| Party | Candidate | Votes | % | |
|---|---|---|---|---|
| Republican | Robert Littell (incumbent) | 31,432 | 74.8% | |
| Democratic | Frederick J. Katz, Jr. | 7,216 | 17.2% | |
| Middle Class Alternative | Gary “Buzz” Howell | 3,363 | 8.0% | |
| Total votes | 42,011 | 100% | ||
District 25
Democratic primary
| Party | Candidate | Votes | % | |
|---|---|---|---|---|
| Democratic | Adele Montgomery | 3,240 | 100% | |
| Total votes | 3,240 | 100% | ||
Republican primary
| Party | Candidate | Votes | % | |
|---|---|---|---|---|
| Republican | John H. Dorsey (incumbent) | 13,696 | 100% | |
| Total votes | 13,696 | 100% | ||
General election
| Party | Candidate | Votes | % | |
|---|---|---|---|---|
| Republican | John H. Dorsey (incumbent) | 31,268 | 71.7% | |
| Democratic | Adele Montgomery | 12,363 | 28.3% | |
| Total votes | 43,631 | 100% | ||
District 26
Democratic primary
| Party | Candidate | Votes | % | |
|---|---|---|---|---|
| Democratic | Drew Britcher | 1,850 | 100% | |
| Total votes | 1,850 | 100% | ||
Republican primary
| Party | Candidate | Votes | % | |
|---|---|---|---|---|
| Republican | Leanna Brown (incumbent) | 8,357 | 100% | |
| Total votes | 8,357 | 100% | ||
General election
| Party | Candidate | Votes | % | |
|---|---|---|---|---|
| Republican | Leanna Brown (incumbent) | 34,063 | 78.2% | |
| Democratic | Drew Britcher | 9,514 | 21.8% | |
| Total votes | 43,577 | 100% | ||
District 27
Democratic primary
| Party | Candidate | Votes | % | |
|---|---|---|---|---|
| Democratic | Richard Codey (incumbent) | 8,568 | 60.89% | |
| Democratic | Mildred Barry Garvin | 5,504 | 39.11% | |
| Total votes | 14,072 | 100% | ||
Republican primary
| Party | Candidate | Votes | % | |
|---|---|---|---|---|
| Republican | Charles F. Cefalu | 1,476 | 100% | |
| Total votes | 1,476 | 100% | ||
General election
| Party | Candidate | Votes | % | |
|---|---|---|---|---|
| Democratic | Richard Codey (incumbent) | 19,677 | 68.1% | |
| Republican | Eugene J. Byrne | 9,202 | 31.9% | |
| Total votes | 28,879 | 100% | ||
District 28
Democratic primary
| Party | Candidate | Votes | % | |
|---|---|---|---|---|
| Democratic | Ronald Rice (incumbent) | 6,611 | 100% | |
| Total votes | 6,611 | 100% | ||
Republican primary
| Party | Candidate | Votes | % | |
|---|---|---|---|---|
| Republican | Brenda Jean-Pierre | 1,085 | 100% | |
| Total votes | 1,085 | 100% | ||
General election
| Party | Candidate | Votes | % | |
|---|---|---|---|---|
| Democratic | Ronald Rice (incumbent) | 15,456 | 67.2% | |
| Republican | Brenda Jean-Pierre | 6,876 | 29.9% | |
| Socialist Workers | Rachel H. Knapik | 666 | 2.9% | |
| Total votes | 22,998 | 100% | ||
District 29
Democratic primary
| Party | Candidate | Votes | % | |
|---|---|---|---|---|
| Democratic | Wynona Lipman (incumbent) | 7,656 | 100% | |
| Total votes | 7,656 | 100% | ||
General election
| Party | Candidate | Votes | % | |
|---|---|---|---|---|
| Democratic | Wynona Lipman (incumbent) | 14,911 | 100% | |
| Total votes | 14,911 | 100% | ||
District 30
Democratic primary
| Party | Candidate | Votes | % | |
|---|---|---|---|---|
| Democratic | Neil J. O'Connell | 2,529 | 100% | |
| Total votes | 2,529 | 100% | ||
Republican primary
| Party | Candidate | Votes | % | |
|---|---|---|---|---|
| Republican | John E. Dimon | 3,862 | 100% | |
| Total votes | 3,862 | 100% | ||
General election
| Party | Candidate | Votes | % | |
|---|---|---|---|---|
| Republican | John E. Dimon | 26,651 | 65.0% | |
| Democratic | Neil J. O’Connell | 14,345 | 35.0% | |
| Total votes | 40,996 | 100% | ||
District 31
Democratic primary
| Party | Candidate | Votes | % | |
|---|---|---|---|---|
| Democratic | Edward T. O'Connor Jr. (incumbent) | 8,221 | 100% | |
| Total votes | 8,221 | 100% | ||
Republican primary
| Party | Candidate | Votes | % | |
|---|---|---|---|---|
| Republican | Bret Schundler | 738 | 62.60% | |
| Republican | Peter Varsalona | 441 | 37.40% | |
| Total votes | 1,179 | 100% | ||
General election
| Party | Candidate | Votes | % | |
|---|---|---|---|---|
| Democratic | Edward T. O'Connor Jr. (incumbent) | 16,719 | 55.1% | |
| Republican | Bret Schundler | 13,601 | 44.9% | |
| Total votes | 30,320 | 100% | ||
District 32
Democratic primary
| Party | Candidate | Votes | % | |
|---|---|---|---|---|
| Democratic | Thomas F. Cowan (incumbent) | 10,968 | 89.58% | |
| Democratic | Ralph Valentin | 1,276 | 10.42% | |
| Total votes | 12,244 | 100% | ||
Republican primary
| Party | Candidate | Votes | % | |
|---|---|---|---|---|
| Republican | Guy Catrillo | 1,533 | 59.74% | |
| Republican | Esmat Zaklama | 1,033 | 40.26% | |
| Total votes | 2,566 | 100% | ||
General election
| Party | Candidate | Votes | % | |
|---|---|---|---|---|
| Democratic | Thomas F. Cowan (incumbent) | 21,128 | 57.1% | |
| Republican | Guy Catrillo | 14,577 | 39.4% | |
| Politicians Are Crooks | Herbert H. Shaw | 1,270 | 3.4% | |
| Total votes | 36,975 | 100% | ||
District 33
Democratic primary
| Party | Candidate | Votes | % | |
|---|---|---|---|---|
| Democratic | Bob Menendez | 8,005 | 100% | |
| Total votes | 8,005 | 100% | ||
Republican primary
| Party | Candidate | Votes | % | |
|---|---|---|---|---|
| Republican | Carlos Munoz | 1,294 | 53.03% | |
| Republican | Reinaldo Fernandez | 1,146 | 46.97% | |
| Total votes | 2,440 | 100% | ||
General election
| Party | Candidate | Votes | % | |
|---|---|---|---|---|
| Democratic | Bob Menendez (incumbent) | 19,151 | 68.9% | |
| Republican | Carlos Munoz | 8,652 | 31.1% | |
| Total votes | 27,803 | 100% | ||
District 34
Democratic primary
| Party | Candidate | Votes | % | |
|---|---|---|---|---|
| Democratic | Joseph A. Mecca | 2,739 | 100% | |
| Total votes | 2,739 | 100% | ||
Republican primary
| Party | Candidate | Votes | % | |
|---|---|---|---|---|
| Republican | Joseph Bubba (incumbent) | 3,395 | 100% | |
| Total votes | 3,395 | 100% | ||
General election
| Party | Candidate | Votes | % | |
|---|---|---|---|---|
| Republican | Joseph Bubba (incumbent) | 25,885 | 52.5% | |
| Democratic | Joseph A. Mecca | 17,237 | 35.0% | |
| Unbossed, Unbiased, Unbought | Newton E. Miller | 6,193 | 12.6% | |
| Total votes | 49,315 | 100% | ||
District 35
Democratic primary
| Party | Candidate | Votes | % | |
|---|---|---|---|---|
| Democratic | John Girgenti | |||
| Total votes | 100% | |||
Republican primary
| Party | Candidate | Votes | % | |
|---|---|---|---|---|
| Republican | Pat Kramer | % | ||
| Total votes | 100% | |||
General election
| Party | Candidate | Votes | % | |
|---|---|---|---|---|
| Democratic | John Girgenti | 15,859 | 53.2% | |
| Republican | Pat Kramer | 13,965 | 46.8% | |
| Total votes | 29,824 | 100% | ||
District 36
Democratic primary
| Party | Candidate | Votes | % | |
|---|---|---|---|---|
| Democratic | Gabe Ambrosio (incumbent) | 3,987 | 100% | |
| Total votes | 3,987 | 100% | ||
Republican primary
| Party | Candidate | Votes | % | |
|---|---|---|---|---|
| Republican | John P. Scott | 2,077 | 100% | |
| Total votes | 2,077 | 100% | ||
General election
| Party | Candidate | Votes | % | |
|---|---|---|---|---|
| Republican | John P. Scott | 21,455 | 52.0% | |
| Democratic | Gabriel M. Ambrosio (incumbent) | 19,775 | 48.0% | |
| Total votes | 41,230 | 100% | ||
District 37
Democratic primary
| Party | Candidate | Votes | % | |
|---|---|---|---|---|
| Democratic | Matthew Feldman | 3,358 | 100% | |
| Total votes | 3,358 | 100% | ||
Republican primary
| Party | Candidate | Votes | % | |
|---|---|---|---|---|
| Republican | Todd Caliguire | 1,690 | 100% | |
| Total votes | 1,690 | 100% | ||
General election
| Party | Candidate | Votes | % | |
|---|---|---|---|---|
| Democratic | Matthew Feldman (incumbent) | 24,309 | 53.6% | |
| Republican | Todd Caliguire | 21,045 | 46.4% | |
| Total votes | 45,354 | 100% | ||
District 38
Democratic primary
| Party | Candidate | Votes | % | |
|---|---|---|---|---|
| Democratic | Paul Contillo | 3,215 | 100% | |
| Total votes | 3,215 | 100% | ||
Republican primary
| Party | Candidate | Votes | % | |
|---|---|---|---|---|
| Republican | Louis F. Kosco | 2,891 | 100% | |
| Total votes | 2,891 | 100% | ||
General election
| Party | Candidate | Votes | % | |
|---|---|---|---|---|
| Republican | Louis F. Kosco | 27,748 | 55.4% | |
| Democratic | Paul Contillo (incumbent) | 20,572 | 41.1% | |
| Taxpayers Only Choice | C. Fischer | 1,773 | 3.5% | |
| Total votes | 50,093 | 100% | ||
District 39
Democratic primary
| Party | Candidate | Votes | % | |
|---|---|---|---|---|
| Democratic | Mary Donohue | 1,781 | 100% | |
| Total votes | 1,781 | 100% | ||
Republican primary
| Party | Candidate | Votes | % | |
|---|---|---|---|---|
| Republican | Gerald Cardinale (incumbent) | 3,066 | 100% | |
| Total votes | 3,066 | 100% | ||
General election
| Party | Candidate | Votes | % | |
|---|---|---|---|---|
| Republican | Gerald Cardinale (incumbent) | 37,135 | 66.9% | |
| Democratic | Mary Donohue | 18,336 | 33.1% | |
| Total votes | 55,471 | 100% | ||
District 40
Democratic primary
| Party | Candidate | Votes | % | |
|---|---|---|---|---|
| Democratic | Frank R. Lucas Jr. | 1,560 | 100% | |
| Total votes | 1,560 | 100% | ||
Republican primary
| Party | Candidate | Votes | % | |
|---|---|---|---|---|
| Republican | Henry McNamara (incumbent) | 3,781 | 100% | |
| Total votes | 3,781 | 100% | ||
General election
| Party | Candidate | Votes | % | |
|---|---|---|---|---|
| Republican | Henry McNamara (incumbent) | 36,666 | 75.5% | |
| Democratic | Frank R. Lucas | 11,884 | 24.5% | |
| Total votes | 48,550 | 100% | ||
References
- Sullivan, Joseph F. (1 Nov 1991). "Focus Is on a Few Close Races for New Jersey Legislature". The New York Times.
- King, Wayne (23 Aug 1992). "N.R.A. Is Politically Armed and, to Florio, Dangerous". The New York Times.
- "Official Results, Primary Election, June 4, 1991" (PDF). Retrieved 17 Aug 2021.
- "Official Results, General Election, November 5, 1991" (PDF). Retrieved 27 June 2021.