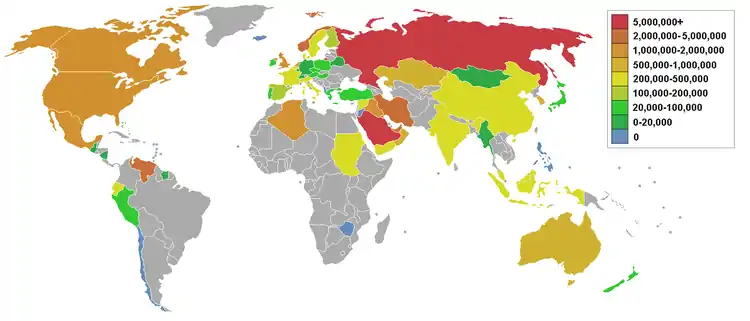
List of countries by oil exports
This is a list of oil-producing countries by oil exports based on The World Factbook and other Sources.[1] Many countries also import oil, and some import more oil than they export.


Countries by rank
| Country/Region | Oil exports (bbl/day) | Date of information |
|---|---|---|
| 6,658,642 | 2020 est. | |
| 4,653,500 | 2020 est. | |
| 3,428,379 | 2020 est. | |
| 3,037,668 | 2020 | |
| 2,700,000 | 2021 est. | |
| 2,418,388 | 2020 | |
| 1,879,288 | 2020 | |
| 1,826,331 | 2020 | |
| 1,501,768 | 2020 | |
| 1,410,917 | 2019 est | |
| 1,219,656 | 2020 | |
| 1,198,511 | 2020 | |
| 859,883 | 2020 est. | |
| 850,000 | 2020 | |
| 832,473 | 2016 est. | |
| 813,000 | 2018 est. | |
| 724,334 | 2020 est. | |
| 540,959 | 2020 est. | |
| 502,801 | 2020 | |
| 486,792 | 2020 | |
| 438,700 | 2020 est. | |
| 361,820 | 2020 est. | |
| 347,156 | 2020 est. | |
| 92,909 | 2020 est. | |
| 110,186 | 2019 est. | |
| 253,157 | 2020 est. | |
| 291,800 | 2010 est. | |
| 282,156 | 2020 est. | |
| 280,000 | 2021 est. | |
| 196,078 | 2020 est. | |
| 113,497 | 2020 est. | |
| 8,875 | 2016 est. | |
| 78,070 | 2016 est. | |
| 154,691 | 2016 est. | |
| 6,580 | 2019 est. | |
| 82,333 | 2020 est. | |
| 97,079 | 2016 est. | |
| 135,431 | 2020 est. | |
| 90,920 | 2010 est. | |
| 87,000 | 2010 est. | |
| 102,750 | 2020 est. | |
| 83,000 | 2012 est. | |
| 77,980 | 2010 est. | |
| 75,340 | 2010 est. | |
| 67,000 | 2012 est. | |
| 55,680 | 2010 est. | |
| 47,290 | 2010 est. | |
| 35,500 | 2013 est. | |
| 33,000 | 2013 est. | |
| 32,200 | 2011 est. | |
| 32,190 | 2010 est. | |
| 28,400 | 2010 est. | |
| 23,320 | 2013 est. | |
| 22,240 | 2010 est. | |
| 20,090 | 2010 est. | |
| 2021 est. | ||
| 15,610 | 2012 est. | |
| 14,260 | 2010 est. | |
| 10,960 | 2010 est. | |
| 7,624 | 2010 est. | |
| 7,621 | 2010 est. | |
| 7,337 | 2010 est. | |
| 6,300 | 2010 est. | |
| 5,680 | 2010 est. | |
| 4,345 | 2010 est. | |
| 3,615 | 2011 est. | |
| 2,181 | 2010 est. | |
| 1,858 | 2010 est. | |
| 765 | 2010 est. | |
| 531 | 2012 est. | |
| 404 | 2010 est. | |
| 263 | 2010 est. | |
| 61 | 2013 est. |
Oil export revenues
Academic contributions have written about differences in petroleum revenue management in various countries. Many scholars see the natural resource wealth in some countries as a natural resource blessing, while in others it has been referred to as a natural resource curse.[2] A vast body of resource curse literature has studied the role of governance regimes, legal frameworks and political risk in building an economy based on natural resource exploitation.[3][4][5] However, whether it is seen as a blessing or a curse, the recent political decisions regarding the future of petroleum production in many countries were given an extractivist direction, thus also granting a status quo to the exploitation of natural resources.[6] The PRIX index forecasts the effect of political developments on exports from major petroleum-producing countries.[7]
See also
References
- "International - U.S. Energy Information Administration (EIA)".
- Sachs J. D.; Warner A.M. (2001). "The curse of natural resources" (PDF). European Economic Review. Vol. 4, no. 45. Archived from the original (PDF) on 2017-05-17. Retrieved 2016-07-13.
- Humphreys, M., Sachs, J. and Stiglitz, J. E. (2007). "Escaping the resource curse". European economic review. Cambridge University Press.
{{cite news}}: CS1 maint: multiple names: authors list (link) - Tietenberg, T. H.; Lewis, L. (2000). "Environmental and natural resource economics".
- Ross, M. L. (2003). "The natural resource curse: How wealth can make you poor". European Economic Review.
- Wilson, E.; Stammler, F. (2015). "Beyond extractivism and alternative cosmologies: Arctic communities and extractive industries in uncertain times". European Economic Review. Vol. 3, no. 1. doi:10.1016/j.exis.2015.12.001.
- "Nuclear Negotiations, Restructuring at Chevron and a New Political Risk Index for Oil Markets". Alberta Oil Magazine. 2015-06-29. Archived from the original on 2015-12-20. Retrieved 2015-09-26.