1971 Danish general election
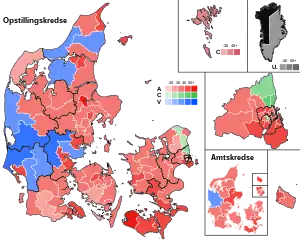
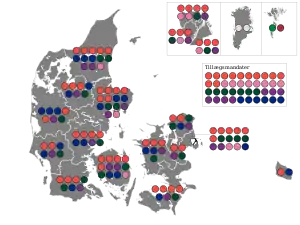
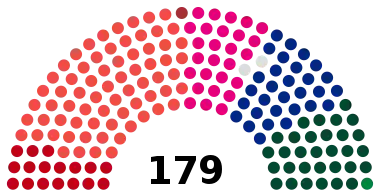
General elections were held in Denmark on 21 September 1971 and in the Faroe Islands on 5 October.[1][2] The Social Democratic Party remained the largest in the Folketing, with 70 of the 179 seats. Voter turnout was 87.2% in Denmark proper, 56.8% in the Faroe Islands and 52.1% in Greenland (where only one of the two constituencies was contested as the other had only a single candidate who was elected unopposed).[3] They were the first elections using the new counties as constituencies.
| |||||||||||||||||||||||||||||||||||||||||||||||||||||||||||||
All 179 seats in the Folketing 90 seats needed for a majority | |||||||||||||||||||||||||||||||||||||||||||||||||||||||||||||
| Turnout | 86.8% | ||||||||||||||||||||||||||||||||||||||||||||||||||||||||||||
|---|---|---|---|---|---|---|---|---|---|---|---|---|---|---|---|---|---|---|---|---|---|---|---|---|---|---|---|---|---|---|---|---|---|---|---|---|---|---|---|---|---|---|---|---|---|---|---|---|---|---|---|---|---|---|---|---|---|---|---|---|---|
This lists parties that won seats. See the complete results below.
| |||||||||||||||||||||||||||||||||||||||||||||||||||||||||||||
Results
 | ||||||
|---|---|---|---|---|---|---|
| Denmark | ||||||
| Party | Votes | % | Seats | +/– | ||
| Social Democratic Party | 1,074,777 | 37.3 | 70 | +8 | ||
| Conservative People's Party | 481,335 | 16.7 | 31 | –6 | ||
| Venstre | 450,904 | 15.6 | 30 | –4 | ||
| Danish Social Liberal Party | 413,620 | 14.3 | 27 | 0 | ||
| Socialist People's Party | 262,756 | 9.1 | 17 | +6 | ||
| Christian People's Party | 57,072 | 1.97 | 0 | New | ||
| Justice Party of Denmark | 50,231 | 1.7 | 0 | 0 | ||
| Left Socialists | 45,979 | 1.6 | 0 | –4 | ||
| Communist Party of Denmark | 39,564 | 1.4 | 0 | 0 | ||
| Schleswig Party | 6,743 | 0.2 | 0 | 0 | ||
| Independents | 919 | 0.0 | 0 | 0 | ||
| Invalid/blank votes | 20,196 | – | – | – | ||
| Total | 2,904,096 | 100 | 175 | 0 | ||
| Faroe Islands | ||||||
| Social Democratic Party | 4,170 | 31.8 | 1 | 0 | ||
| Union Party | 2,855 | 21.8 | 0 | 0 | ||
| People's Party | 2,680 | 20.4 | 1 | 0 | ||
| Self-Government Party | 648 | 4.9 | 0 | New | ||
| Progress Party | 362 | 2.8 | 0 | 0 | ||
| Independents | 2,140 | 16.3 | 0 | New | ||
| Invalid/blank votes | 77 | – | – | – | ||
| Total | 13,202 | 100 | 2 | 0 | ||
| Greenland | ||||||
| Independents | 7,148 | 100 | 2 | 0 | ||
| Invalid/blank votes | 195 | – | – | – | ||
| Total | 7,343 | 100 | 2 | 0 | ||
| Source: Nohlen & Stöver | ||||||
References
- Dieter Nohlen & Philip Stöver (2010) Elections in Europe: A data handbook, p524 ISBN 978-3-8329-5609-7
- Denmark Inter-Parliamentary Union
- Nohlen & Stöver, pp543-544
| Folketing elections |
|
|---|---|
| Landsting elections | |
| European elections | |
| Local elections | |
| Other elections |
|
| Referendums | |
| |
This article is issued from Wikipedia. The text is licensed under Creative Commons - Attribution - Sharealike. Additional terms may apply for the media files.