2014 South Lakeland District Council election
The 2014 South Lakeland District Council election took place on 22 May 2014 to elect members of South Lakeland District Council in England.[2] This was on the same day as other local elections.
| |||||||||||||||||||||||||||||||||
17 of the 51 seats to South Lakeland District Council 26 seats needed for a majority | |||||||||||||||||||||||||||||||||
|---|---|---|---|---|---|---|---|---|---|---|---|---|---|---|---|---|---|---|---|---|---|---|---|---|---|---|---|---|---|---|---|---|---|
| |||||||||||||||||||||||||||||||||
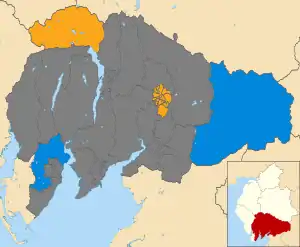 Map showing the results the 2014 South Lakeland District Council elections by ward. Liberal Democrats in yellow and Conservatives in blue. Wards in dark grey were not contested in 2014. | |||||||||||||||||||||||||||||||||
| |||||||||||||||||||||||||||||||||
Election results summary
| Party | Previous council | New council | +/- | |
|---|---|---|---|---|
| Liberal Democrats | 33 | 33 | ||
| Conservatives | 14 | 15 | ||
| Labour | 3 | 3 | ||
| Independent | 1 | 0 | ||
| Total | 51 | 51 | ||
| Working majority | 15 | 15 | ||
| Party | Seats | Gains | Losses | Net gain/loss | Seats % | Votes % | Votes | +/− | |
|---|---|---|---|---|---|---|---|---|---|
| Liberal Democrats | 15 | 0 | 1 | -1 | 88.2 | 55.8 | 8,805 | ||
| Conservative | 2 | 1 | 0 | +1 | 11.8 | 24.6 | 3,876 | ||
| Green | 0 | 0 | 0 | 0 | 0 | 8.6 | 1,356 | ||
| Labour | 0 | 0 | 0 | 0 | 0 | 8.5 | 1,339 | ||
| UKIP | 0 | 0 | 0 | 0 | 0 | 1.7 | 266 | ||
| Independent | 0 | 0 | 0 | 0 | 0 | 0.8 | 125 | ||
Ward Results
| Party | Candidate | Votes | % | ±% | |
|---|---|---|---|---|---|
| Liberal Democrats | Heidi Halliday | 828 | 64.3 | +2.6 | |
| Conservative | Jessie Alston | 293 | 22.7 | -10.6 | |
| Labour | Rebecca Costello | 84 | 6.5 | +1.5 | |
| Green | Angela Towers | 83 | 6.4 | N/A | |
| Majority | 535 | 41.6 | +13.2 | ||
| Turnout | 45.59 | -16.5 | |||
| Liberal Democrats hold | Swing | ||||
| Party | Candidate | Votes | % | ±% | |
|---|---|---|---|---|---|
| Liberal Democrats | Chris Hogg | 442 | 62.7 | -5.9 | |
| Conservative | Eric Hookway | 159 | 22.6 | -8.8 | |
| Green | Liz Ashburn | 58 | 8.2 | N/A | |
| UKIP | Paul Martin | 46 | 6.5 | N/A | |
| Majority | 283 | 40.1 | +2.8 | ||
| Turnout | 47.89 | -29.0 | |||
| Liberal Democrats hold | Swing | ||||
| Party | Candidate | Votes | % | ±% | |
|---|---|---|---|---|---|
| Liberal Democrats | Shirley Evans | 479 | 71.6 | +10.9 | |
| Conservative | Lyndsay Slater | 92 | 13.8 | -14.2 | |
| Green | Daphne Jackson | 59 | 8.8 | N/A | |
| Labour | Ian Law | 39 | 5.5 | -5.5 | |
| Majority | 387 | 57.8 | +25.1 | ||
| Turnout | 43.50 | -24.0 | |||
| Liberal Democrats hold | Swing | ||||
| Party | Candidate | Votes | % | ±% | |
|---|---|---|---|---|---|
| Liberal Democrats | Giles Archibald* | 527 | 60.0 | -15.3 | |
| Green | Gwen Harrison | 175 | 19.9 | N/A | |
| Labour | Virginia Branney | 111 | 12.6 | -12.1 | |
| Conservative | Micky Pierson | 66 | 7.5 | N/A | |
| Majority | 352 | 40.1 | -10.6 | ||
| Turnout | 52.07 | -14.2 | |||
| Liberal Democrats hold | Swing | ||||
| Party | Candidate | Votes | % | ±% | |
|---|---|---|---|---|---|
| Liberal Democrats | Phil Walker | 489 | 63.3 | -9.3 | |
| Conservative | Paul Rodman | 186 | 24.1 | -3.3 | |
| Green | Gwen Harrison | 57 | 7.4 | N/A | |
| Labour | Gwen Harrison | 40 | 5.2 | N/A | |
| Majority | 303 | 39.2 | -5.9 | ||
| Turnout | 50.79 | -28.5 | |||
| Liberal Democrats hold | Swing | ||||
| Party | Candidate | Votes | % | ±% | |
|---|---|---|---|---|---|
| Liberal Democrats | Philip Dixon* | 413 | 54.3 | -10.8 | |
| Labour | Marilyn Molloy | 153 | 20.1 | +7.7 | |
| Green | Rachael Passant-Coy | 107 | 14.1 | N/A | |
| Conservative | Bill Wearing | 87 | 11.4 | -11.1 | |
| Majority | 260 | 34.2 | -8.4 | ||
| Turnout | 43.18 | -23.8 | |||
| Liberal Democrats hold | Swing | ||||
| Party | Candidate | Votes | % | ±% | |
|---|---|---|---|---|---|
| Liberal Democrats | Alvin Finch | 483 | 72.5 | +12.4 | |
| Conservative | Elizabeth Cartmell | 69 | 10.4 | -10.1 | |
| Labour | Tony Rothwell | 69 | 10.4 | -9.1 | |
| Green | Chris Rowley | 45 | 6.8 | N/A | |
| Majority | 414 | 62.1 | +22.5 | ||
| Turnout | 39.22 | -23.1 | |||
| Liberal Democrats hold | Swing | ||||
| Party | Candidate | Votes | % | ±% | |
|---|---|---|---|---|---|
| Liberal Democrats | David Evans* | 431 | 62.9 | -8.9 | |
| Green | Karen Mitchell | 96 | 14.0 | N/A | |
| Conservative | Ian Keeling | 80 | 11.7 | -16.5 | |
| Labour | Jim Barker | 78 | 11.4 | N/A | |
| Majority | 335 | 48.9 | +5.3 | ||
| Turnout | 43.63 | -30.0 | |||
| Liberal Democrats hold | Swing | ||||
| Party | Candidate | Votes | % | ±% | |
|---|---|---|---|---|---|
| Liberal Democrats | Clare Feeney-Johnson* | 538 | 72.1 | +2.9 | |
| Conservative | Derrick Wade | 99 | 13.3 | -10.5 | |
| Green | Andy Mason | 58 | 7.8 | N/A | |
| Labour | Alison Gilchrist | 51 | 6.8 | -0.2 | |
| Majority | 439 | 58.8 | +13.4 | ||
| Turnout | 45.71 | -29.4 | |||
| Liberal Democrats hold | Swing | ||||
| Party | Candidate | Votes | % | ±% | |
|---|---|---|---|---|---|
| Liberal Democrats | Brenda Gray* | 477 | 54.3 | +0.3 | |
| Conservative | Patrick Birchall | 281 | 32.0 | -10.0 | |
| Labour | John Bateson | 62 | 7.1 | +3.2 | |
| Green | Jocelyn Gaskell | 58 | 6.6 | N/A | |
| Majority | 196 | 22.3 | +10.3 | ||
| Turnout | 49.89 | -37.6 | |||
| Liberal Democrats hold | Swing | ||||
| Party | Candidate | Votes | % | ±% | |
|---|---|---|---|---|---|
| Liberal Democrats | Jonathan Brook* | 425 | 55.6 | -9.5 | |
| Conservative | Nigel Byrom | 230 | 30.1 | +3.6 | |
| Green | Mandy Barnett | 67 | 8.8 | N/A | |
| Labour | Florence Scullard | 42 | 5.5 | -2.9 | |
| Majority | 195 | 25.5 | -13.2 | ||
| Turnout | 45.45 | -26.6 | |||
| Liberal Democrats hold | Swing | ||||
| Party | Candidate | Votes | % | ±% | |
|---|---|---|---|---|---|
| Liberal Democrats | Graham Vincent* | 423 | 62.3 | -0.6 | |
| Conservative | Mike Nicholson | 120 | 17.7 | -9.6 | |
| Labour | Dave Cope | 70 | 10.3 | +0.5 | |
| Green | Adam Sandell | 66 | 9.7 | N/A | |
| Majority | 303 | 44.6 | +9.0 | ||
| Turnout | 41.00 | -30.9 | |||
| Liberal Democrats hold | Swing | ||||
| Party | Candidate | Votes | % | ±% | |
|---|---|---|---|---|---|
| Liberal Democrats | Sylvia Emmott* | 540 | 63.8 | -1.4 | |
| Conservative | Mel Mackie | 137 | 16.2 | -13.0 | |
| UKIP | Stephen Willmott | 78 | 9.2 | N/A | |
| Labour | Lois Sparling | 46 | 5.4 | -0.1 | |
| Green | Rory Black | 45 | 5.3 | N/A | |
| Majority | 403 | 47.6 | +11.6 | ||
| Turnout | 51.90 | -28.7 | |||
| Liberal Democrats hold | Swing | ||||
| Party | Candidate | Votes | % | ±% | |
|---|---|---|---|---|---|
| Liberal Democrats | Stephen Coleman* | 405 | 57.4 | -7.8 | |
| Green | Kate Willshaw | 87 | 12.3 | N/A | |
| Conservative | Stephen Chambers | 76 | 10.8 | -13.8 | |
| Labour | Jim Ring | 73 | 10.3 | +0.1 | |
| UKIP | Malcolm Nightingale | 65 | 9.2 | N/A | |
| Majority | 318 | 45.1 | +4.6 | ||
| Turnout | 48.29 | -27.2 | |||
| Liberal Democrats hold | Swing | ||||
| Party | Candidate | Votes | % | ±% | |
|---|---|---|---|---|---|
| Liberal Democrats | Matt Severn | 368 | 46.3 | -14.0 | |
| Independent | Rob Boden* | 125 | 15.7 | -44.6 | |
| Labour | Paul Braithwaite | 114 | 14.4 | -0.5 | |
| UKIP | Susan Bownass | 77 | 9.7 | N/A | |
| Conservative | Karen Dawson | 56 | 7.1 | -17.7 | |
| Green | Vanessa Moss | 54 | 6.8 | N/A | |
| Majority | 243 | 30.6 | -5.0 | ||
| Turnout | 47.92 | -21.3 | |||
| Liberal Democrats hold | Swing | ||||
- Rob Boden was originally elected as a Liberal Democrat.
| Party | Candidate | Votes | % | ±% | |
|---|---|---|---|---|---|
| Conservative | Caroline Airey* | 643 | 46.0 | -2.8 | |
| Liberal Democrats | Loraine Birchall | 462 | 33.0 | -9.5 | |
| Labour | David Webster | 195 | 13.9 | N/A | |
| Green | Chris Loynes | 98 | 7.0 | -1.7 | |
| Majority | 181 | 13.0 | +6.7 | ||
| Turnout | 44.86 | -28.3 | |||
| Conservative hold | Swing | ||||
| Party | Candidate | Votes | % | ±% | |
|---|---|---|---|---|---|
| Conservative | Kevin Lancaster | 1,202 | 47.5 | +3.0 | |
| Liberal Democrats | Ron Bulman | 1,075 | 42.5 | -9.1 | |
| Green | Andi Chapple | 143 | 5.6 | N/A | |
| Labour | Martin Holborn | 112 | 4.4 | +0.6 | |
| Majority | 127 | 5.0 | N/A | ||
| Turnout | 53.03 | -25.1 | |||
| Conservative gain from Liberal Democrats | Swing | ||||
By-Elections
| Party | Candidate | Votes | % | ±% | |
|---|---|---|---|---|---|
| Liberal Democrats | Dyan Jones | 416 | 64.0 | -5.9 | |
| Conservative | Sandra Lilley | 184 | 28.3 | +13.1 | |
| Green | Gwen Harrison | 50 | 7.7 | N/A | |
| Majority | 232 | 35.7 | -19.0 | ||
| Turnout | 650 | 39.42 | -7.2 | ||
| Liberal Democrats hold | Swing | ||||
References
- Steven Ayres (11 June 2014). "Local elections 2014". House of Commons Library. p. 20.
- "England council results". BBC News. Retrieved 23 May 2014.
| Cumberland Council |
|
|---|---|
| Westmorland and Furness Council | |
| Cumbria County Council | |
| Allerdale Borough Council | |
| Barrow-in-Furness Borough Council | |
| Carlisle City Council | |
| Copeland Borough Council | |
| Eden District Council | |
| South Lakeland District Council | |
| Cumberland County Council |
|
| Westmorland County Council |
|
| |
This article is issued from Wikipedia. The text is licensed under Creative Commons - Attribution - Sharealike. Additional terms may apply for the media files.